Power BI Bookmarks: Interactive Storytelling and Navigation
Learn how to use Power BI Bookmarks to create interactive storytelling, guided navigation, and app-like dashboards that engage users.
Power BI Bookmarks are one of the most powerful tools for creating interactive, user-driven experiences within dashboards. They allow you to capture the current state of a report page—including filters, slicers, visuals, and drill-throughs—and return to it with a single click. Bookmarks work best when combined with a strong visual foundation — custom themes for colors and fonts, and backgrounds/icons for layout and navigation cues.
🔍 What Power BI Bookmarks Can Do
- Toggle between different views or scenarios
- Create guided navigation or storytelling flows
- Simulate tabs or multi-step workflows
- Reset filters or highlight key metrics
- Enhance accessibility and user enablement
🛠 How to Use Power BI Bookmarks in Dashboards
In my dashboards, I use bookmarks to:
- Create “Quick View” toggles between summary and detail
- Build guided walkthroughs for onboarding new users
- Reset slicers to default states for clarity
- Highlight strategic KPIs during leadership reviews
Bookmarks paired with buttons and selection panes create a seamless experience that feels more like an app than a static report.
For example, a branded report template ensures consistency, while bookmarks add the interactivity on top.
💡 Pro Tips for Power BI Bookmarks
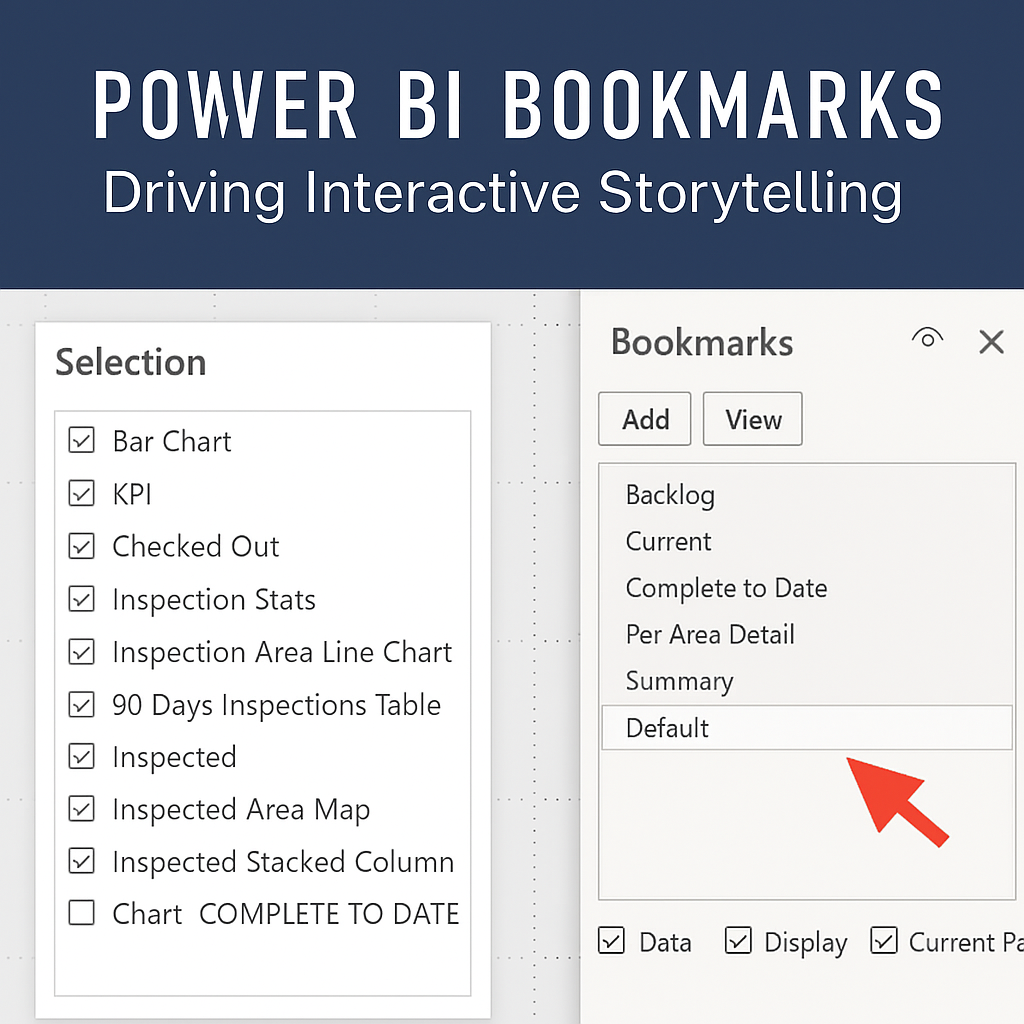
Use Groups in the Selection Pane to organize visuals and buttons tied to each bookmark. This keeps your layout clean and makes maintenance easier—especially when scaling across multiple pages.
📬 Learn More About Power BI Bookmarks
I’m always happy to share techniques for building intuitive, high-impact dashboards. Feel free to connect via LinkedIn or explore more Power BI insights on my homepage.
❓ Frequently Asked Questions about Power BI Bookmarks
What are Power BI bookmarks used for?
Bookmarks capture the current state of a report page — including filters, slicers, and visuals — and let you return to it with one click.
How do I create a bookmark in Power BI?
Go to the View → Bookmarks Pane, configure your report view, and click Add to save it.
Can bookmarks improve navigation?
Yes. Paired with buttons, bookmarks can simulate tabs, guided walkthroughs, or reset filters, making reports feel interactive.
What’s the difference between bookmarks and drill-through?
Bookmarks save a specific view of a page, while drill-through navigates to a different page filtered by a selected data point.