Surfacing Power BI Model Metadata with INFO Functions
Use INFO.TABLES, INFO.COLUMNS, INFO.RELATIONSHIPS, and INFO.MEASURES to expose model metadata directly in Power BI for documentation, QA, and governance.
Whether you’re stepping into leadership for the first time or taking on a new team, this site is about building clarity, consistency, and confidence through analytics and enablement. I share practical frameworks, SQL/Power BI walkthroughs, and lessons learned from leading teams in complex environments — so you can focus on making better decisions and empowering your people.
Use INFO.TABLES, INFO.COLUMNS, INFO.RELATIONSHIPS, and INFO.MEASURES to expose model metadata directly in Power BI for documentation, QA, and governance.
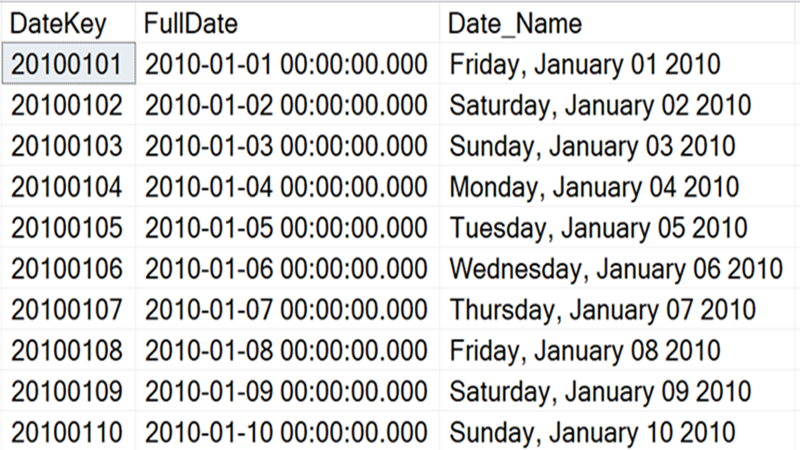
Learn how to create and populate a reusable SQL date table that powers consistent time intelligence in analytics and Power BI.
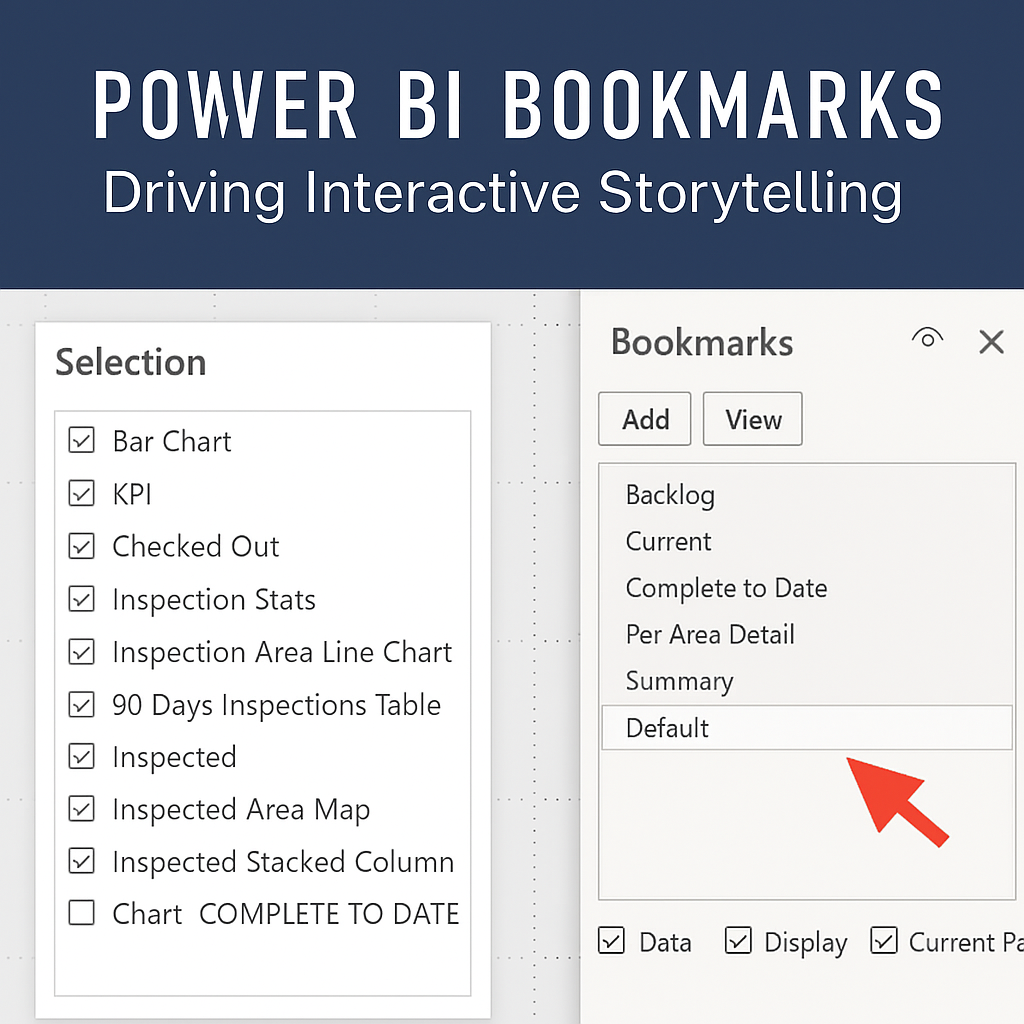
Learn how to use Power BI Bookmarks to create interactive storytelling, guided navigation, and app-like dashboards that engage users.
Learn how to design Power BI report backgrounds and custom icons in PowerPoint to create polished, branded dashboards that align with your theme.
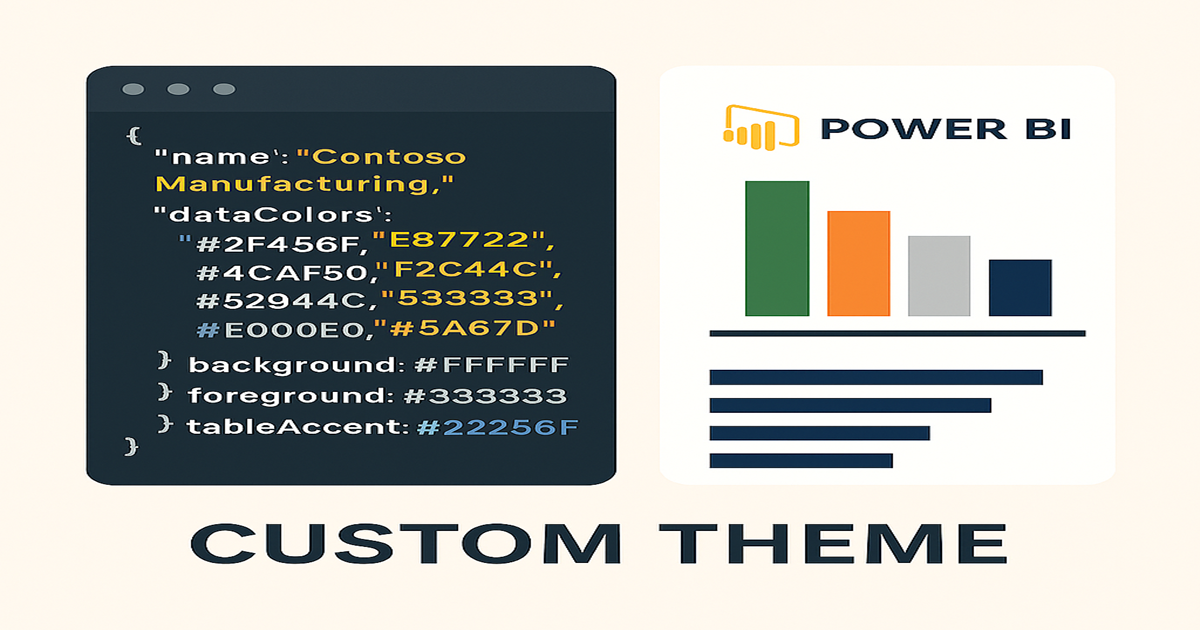
Learn how to create a custom Power BI theme with JSON, colors, fonts, and filter pane settings to align reports with your brand.
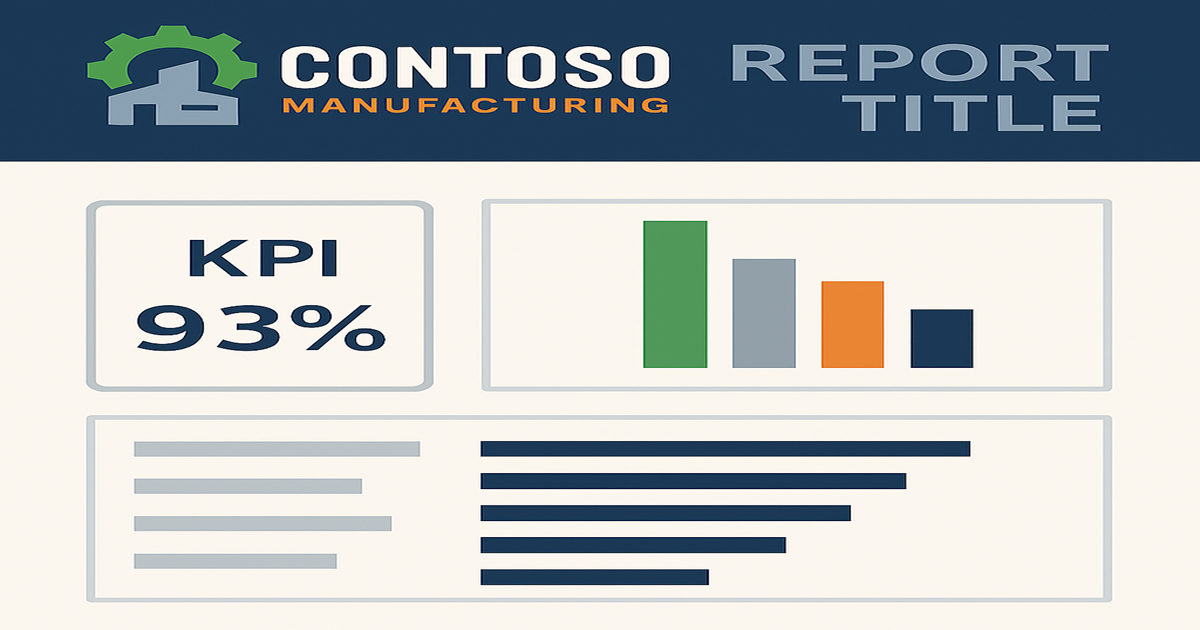
Learn how to establish Power BI report templates that reinforce branding, improve consistency, and scale reporting across your team.
A strategic guide for new analytics team leads on building a scalable foundation using the Microsoft ecosystem.